VirtSilv Whitepaper
In a reality where many people say nice words, such as digitalization, transparency, sustainability, we come up with the solution.
VirtSilv is scaling nationwide!
Using the objective data collected in the field, the artificial intelligence, and the computing power of the VirtSilv platform, we would generate maps with the main characteristics of the Romanian forests in unprecedented detail! And we did it out of a passion for our forests! VirtSilv is the beginning of scalable and modern silviculture. A breakthrough in innovation that has the power to bring the forest biodata to your fingertips!
If you want to see our current estimates, from 2021, about the volume, diameter, height, base area, and even the average age of an area of interest, consult the platform and read the following.
1. Methodology
1.1. Sampling area
The sampling area is chosen in conformity with the project guidelines.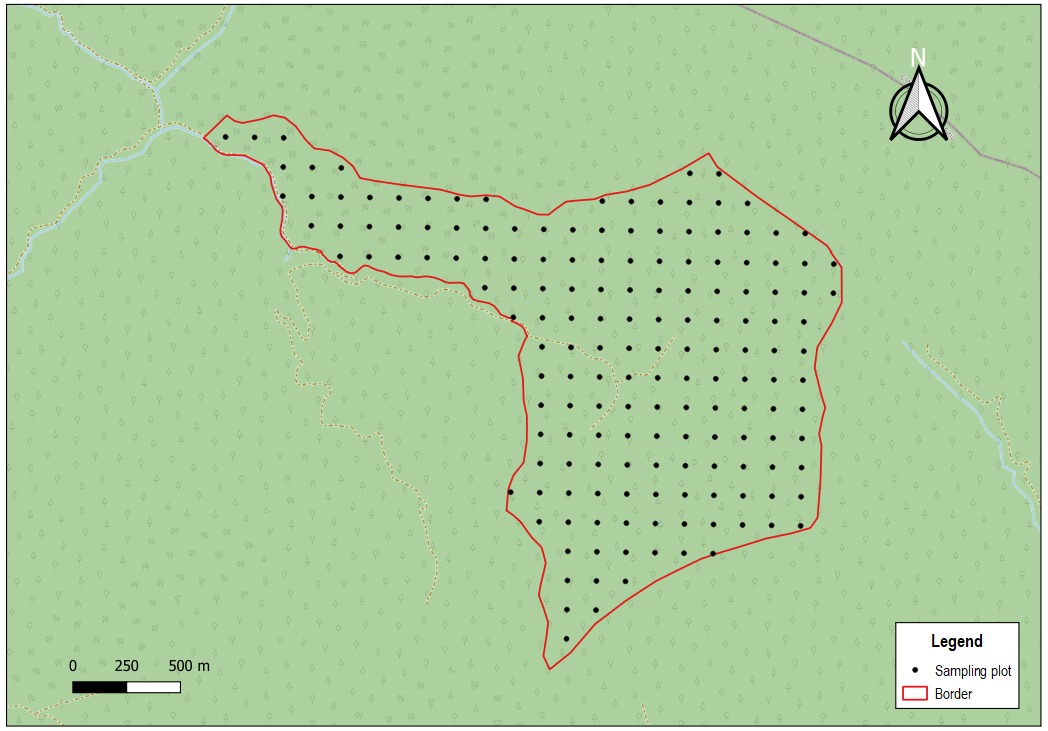
Figure 1 - Sampling plot distribution map
1.2. Field 3D laser scanning
A mobile scanner is used to accurately determine the tree biometrics: position, number, diameter, and height of each tree. With further processing, the commercial volume can be found, as well as splitting the tree in specific lengths of logs.
The device used is a portable scanner with a 3D versatile mapping technology, adaptable to any environment, namely GeoSlam Horizon. In addition, a 360 camera is used to record the environment.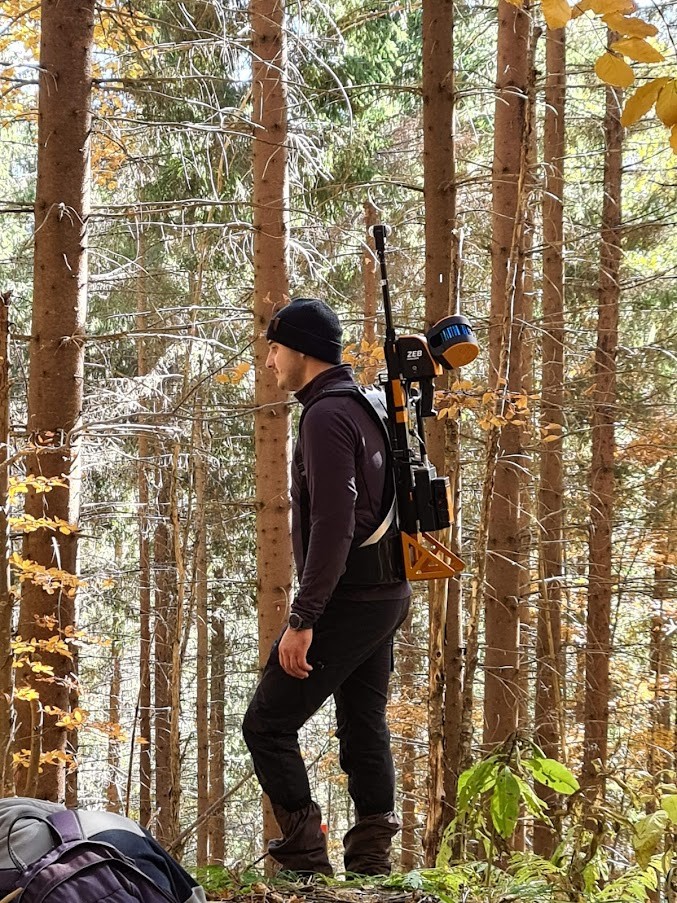
Figure 2 - GeoSLAM Horizon mobile scanner
The advantages of this type of scanner are the following:
- SLAM does not require any GNSS input, the software can be used to dynamically process data mapping from both indoor and outdoor environments while on the move.
- Accurate ground correlation can be achieved either by scanning known sounding points or by integrating existing clouds with georeferenced points.
- Proven ability to scan faster than traditional surveys or static terrestrial laser scanning thus reducing scanning time, in many cases by half.
- 100 m range and 300,000 points per second give high-density point clouds.
- User friendly and easy to use
After taking over the raw data from the field, these are being downloaded from the central unit of the scanner, with the help of a USB stick. Following is the stage of processing the raw data. For this, we use GeoSLAM HUB for Desktop, which is the local processing version of the SLAM software (simultaneous location and mapping). The software is used to automatically record data captured by the GeoSLAM mobile scanner laser systems, to produce fully aligned 3D point clouds.
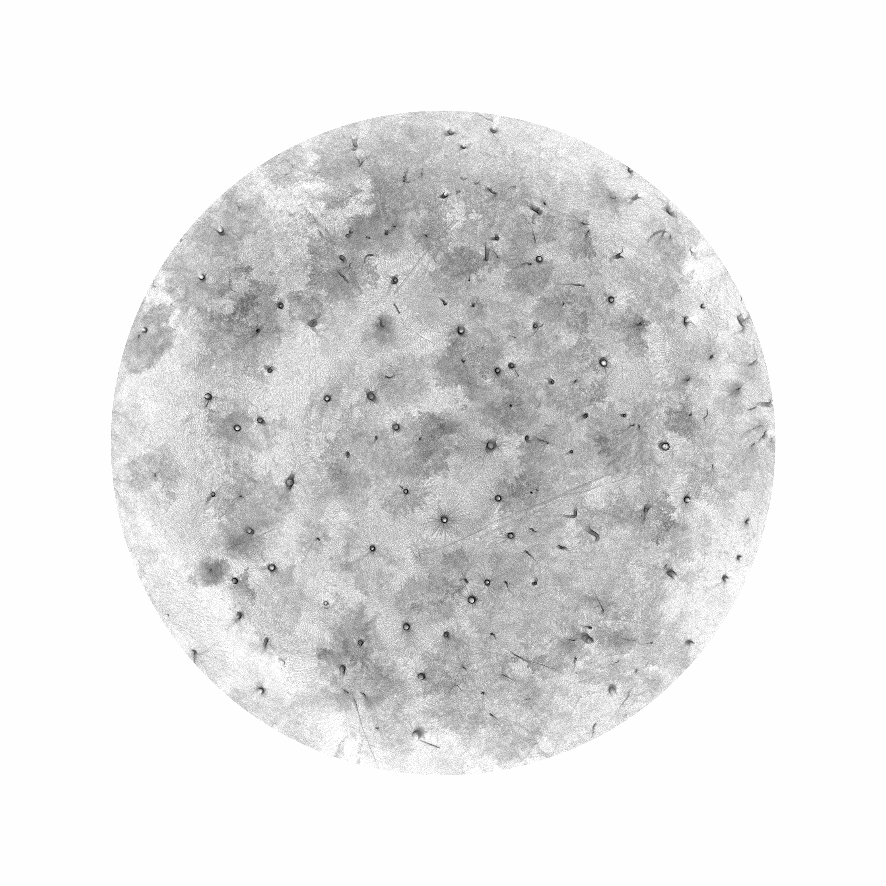

Figure 3 - Raw point cloud top view and segmented trees profile
1.3. Tree characteristics determination
1.3.1. Tree segmentation
The process involves the use of very complex algorithms divided into 4 steps:
- distinguishing the points that represent the soil from the points that represent the above-ground forest vegetation;
- creating the digital terrain model;
- identification of tree trunks (automatic detection of trees);
- tree reconstruction.
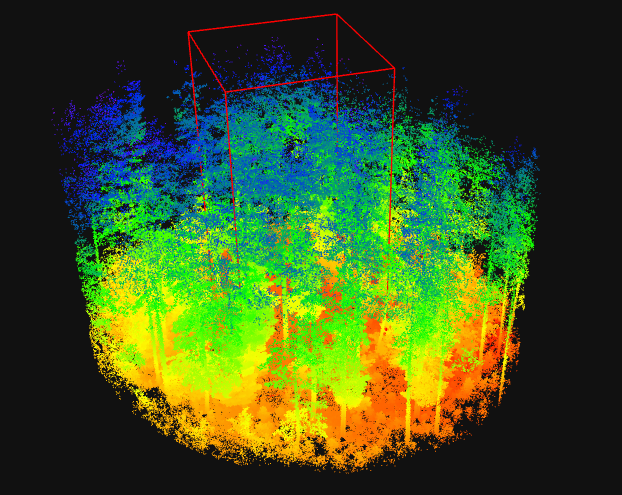
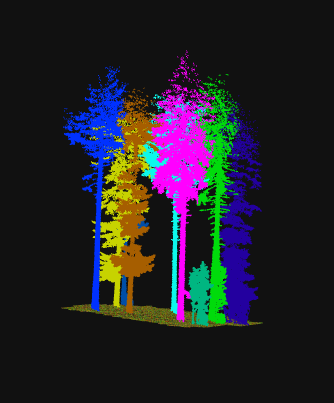
Figure 4 - Example of tree segmentation used in VirtSilv
(Left: Raw point cloud Right: Automatically reconstructed trees)
1.3.2. Determining the characteristics of each tree and the forest stand
In order to characterize the plot, the characteristics of each tree were determined, establishing the main taxing and spatial elements necessary for this, such as:
- XYZ position (translated to GPS)
- diameter at 1.30m height (DBH)
- height (H)
- trunk shape
- volume (m3)
- branches volume (m3)
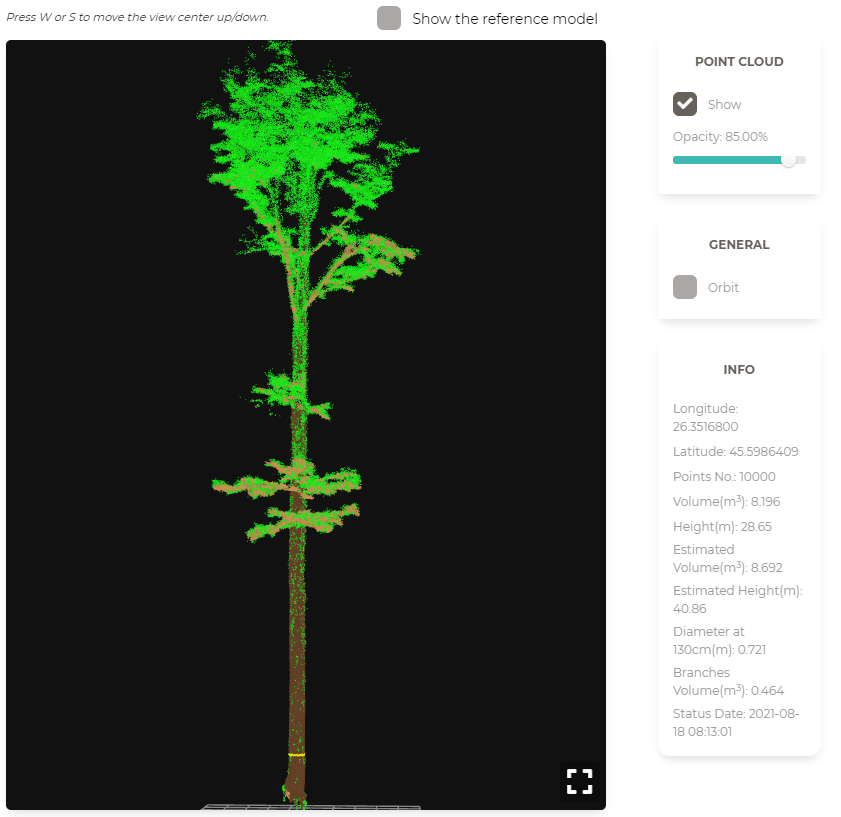
Figure 5 - Example of automatic classification of point cloud for a single tree
VirtSilv classifies the point cloud in above-ground and on-ground biomass. The above-ground biomass was determined based on the point cloud, forming a custom pattern for each tree.
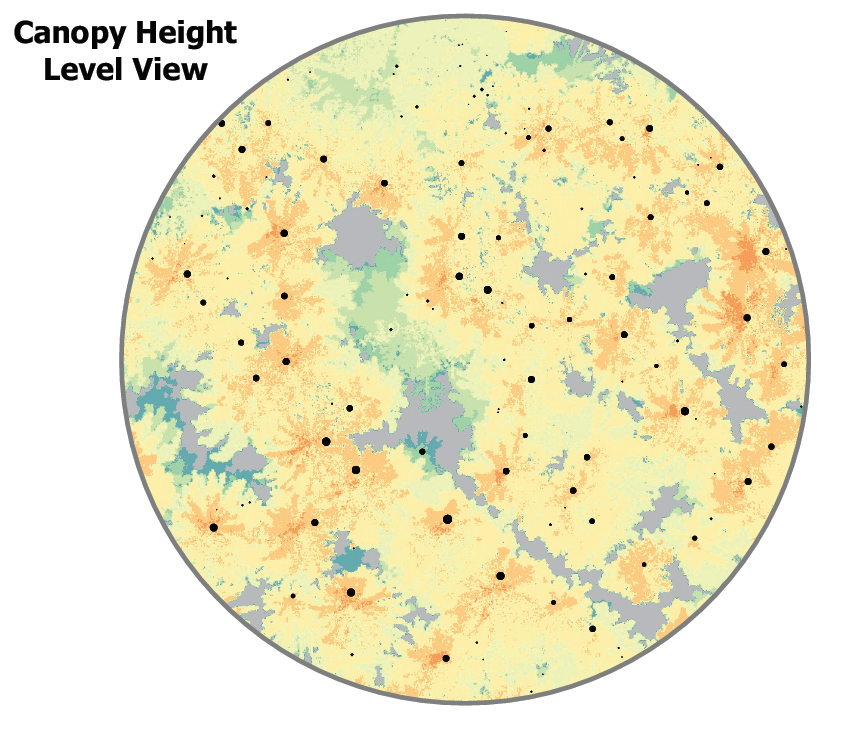
As results of VirtSilv algorithms are the 2D pictures of individual trees (fig. 6) and on a plot level. The canopy height model (.tif) is done based on the point cloud and can be further paired with satellite data (fig. 7). Another product is the density projection at ground level which determines the biomass on the forest floor (fig. 8).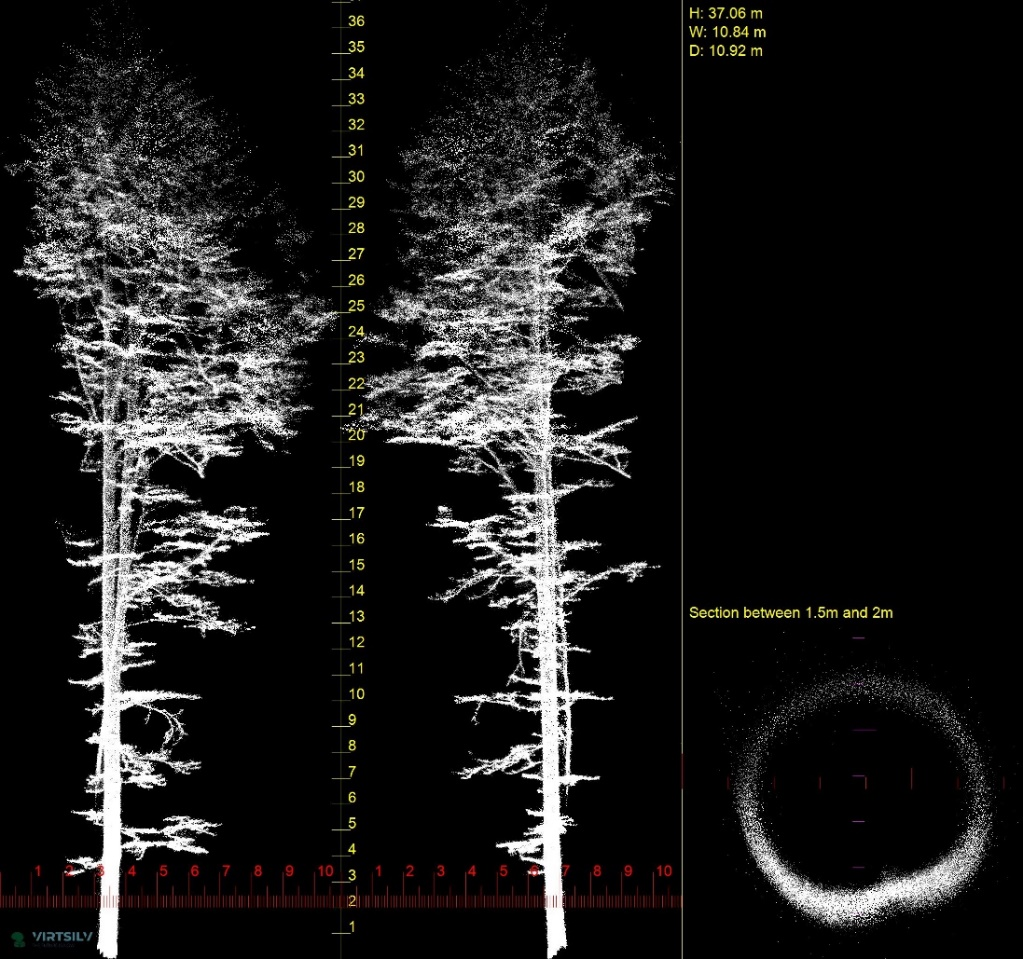
Figure 6 – the 2D image of individual tree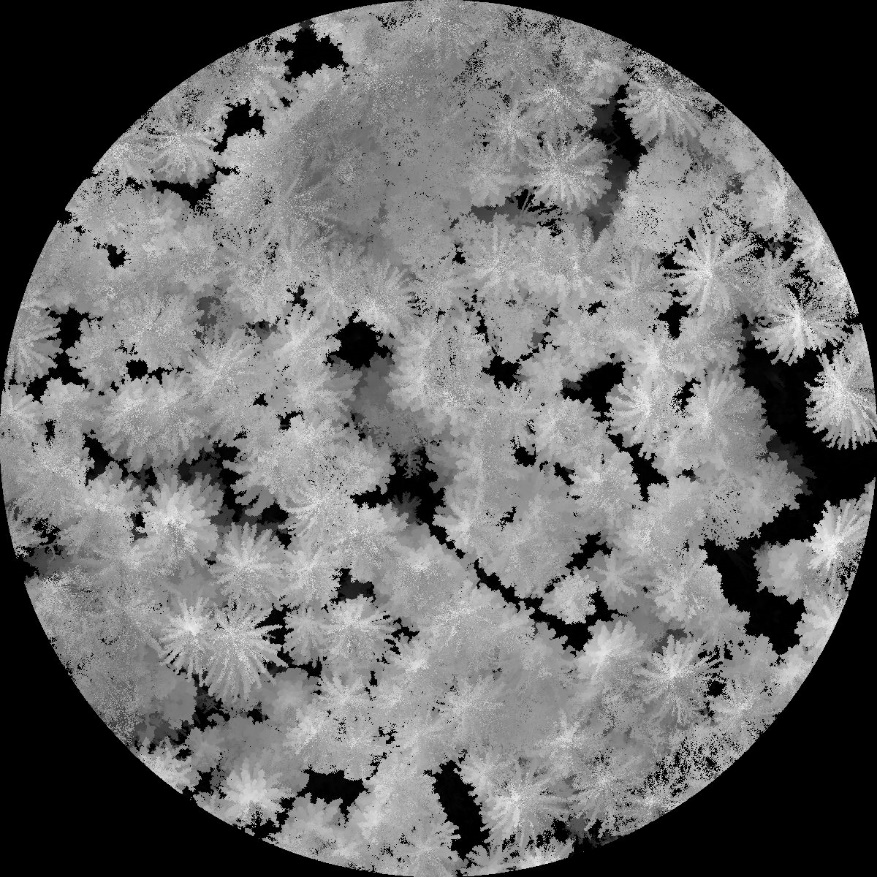
Figure 7 – Canopy height model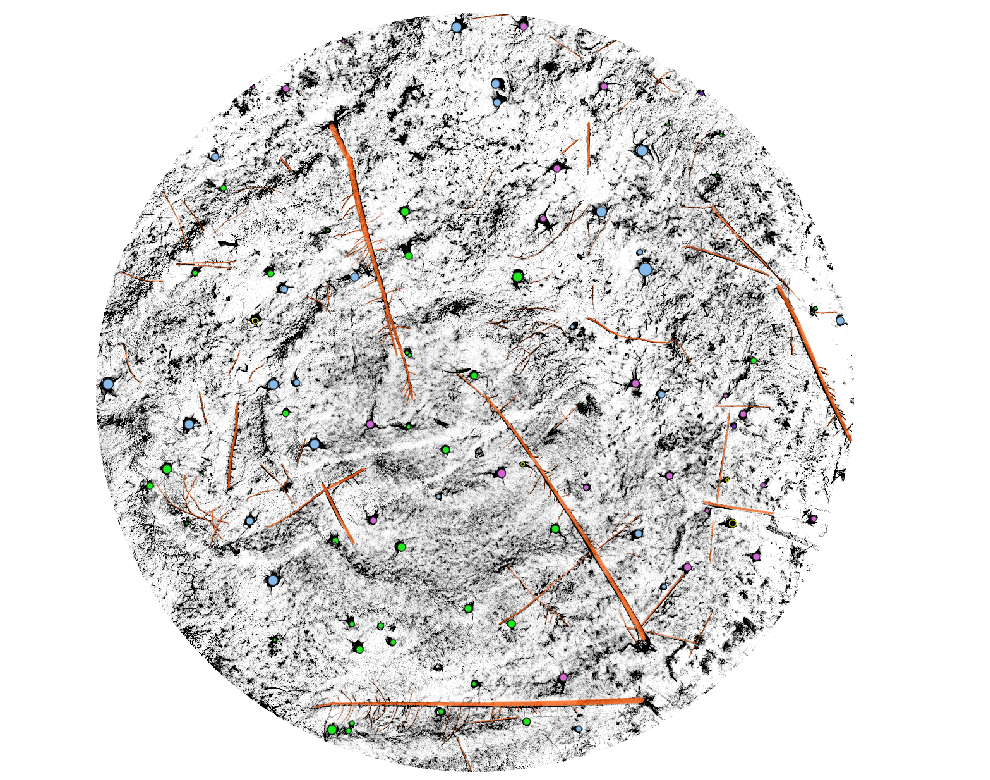
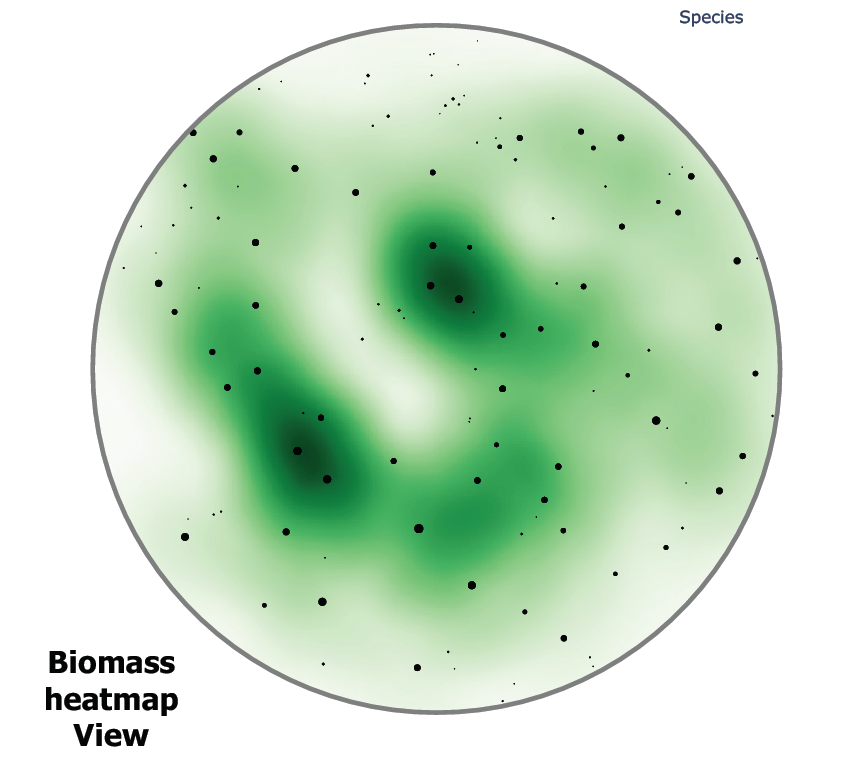
Figure 8 – Density projection at ground-level
1.3.3. Superior capitalization of the standing trunk
A great tool is to know what you can do with the wood before is harvested. VirtSilv is analyzing the tree and based on its shape and custom input parameters can define the resulting logs on desired assortments (fig. 9). This allows for a superior capitalization of the tree’s trunk and essential cost calculation before the harvesting operations, making it a must-have tool in modern silviculture. The results of this product are distributions regarding the industrial wood volume and a virtual sorting of the volume that can be industrially capitalized.
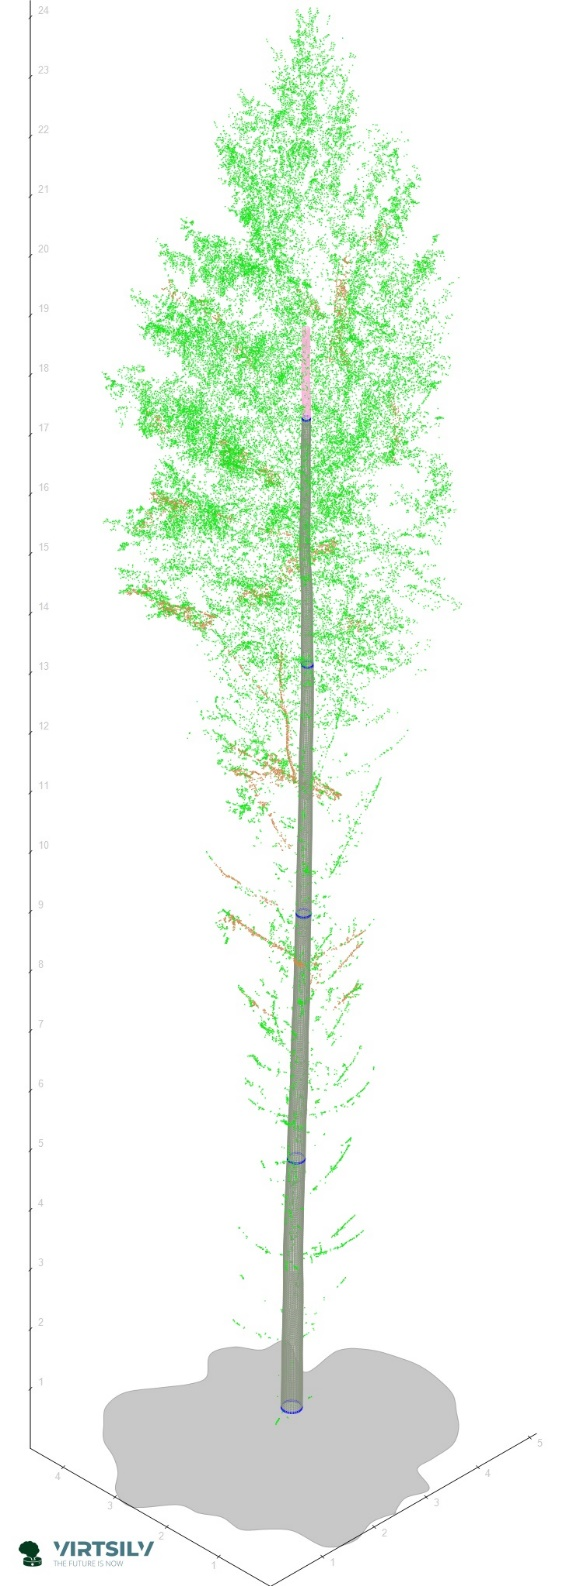
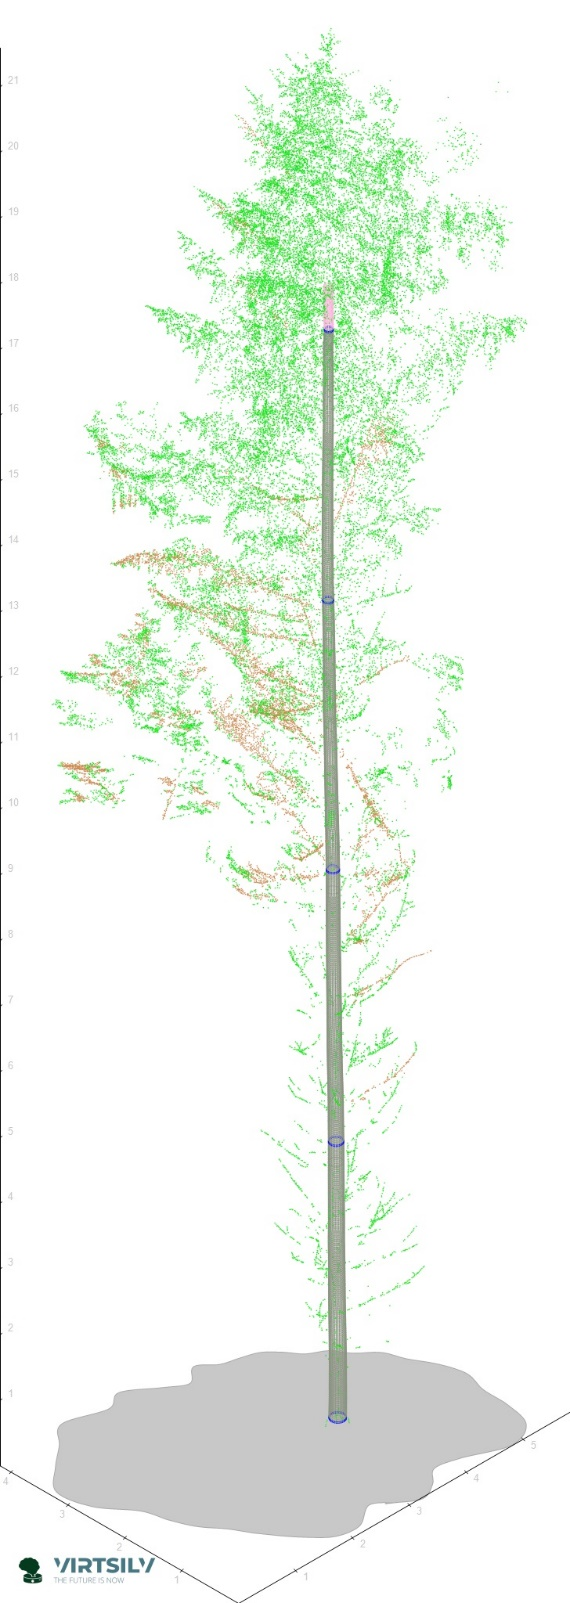
Figure 9 – Standing tree divided into logs assortments
1.3.4. Species determination
The species were determined using visual inspection of the results in a mobile GIS application. During the field scanning procedure, with a 360-camera mounted on the device, photospheres were recorded. Photospheres can be viewed from anywhere as they are hosted online.
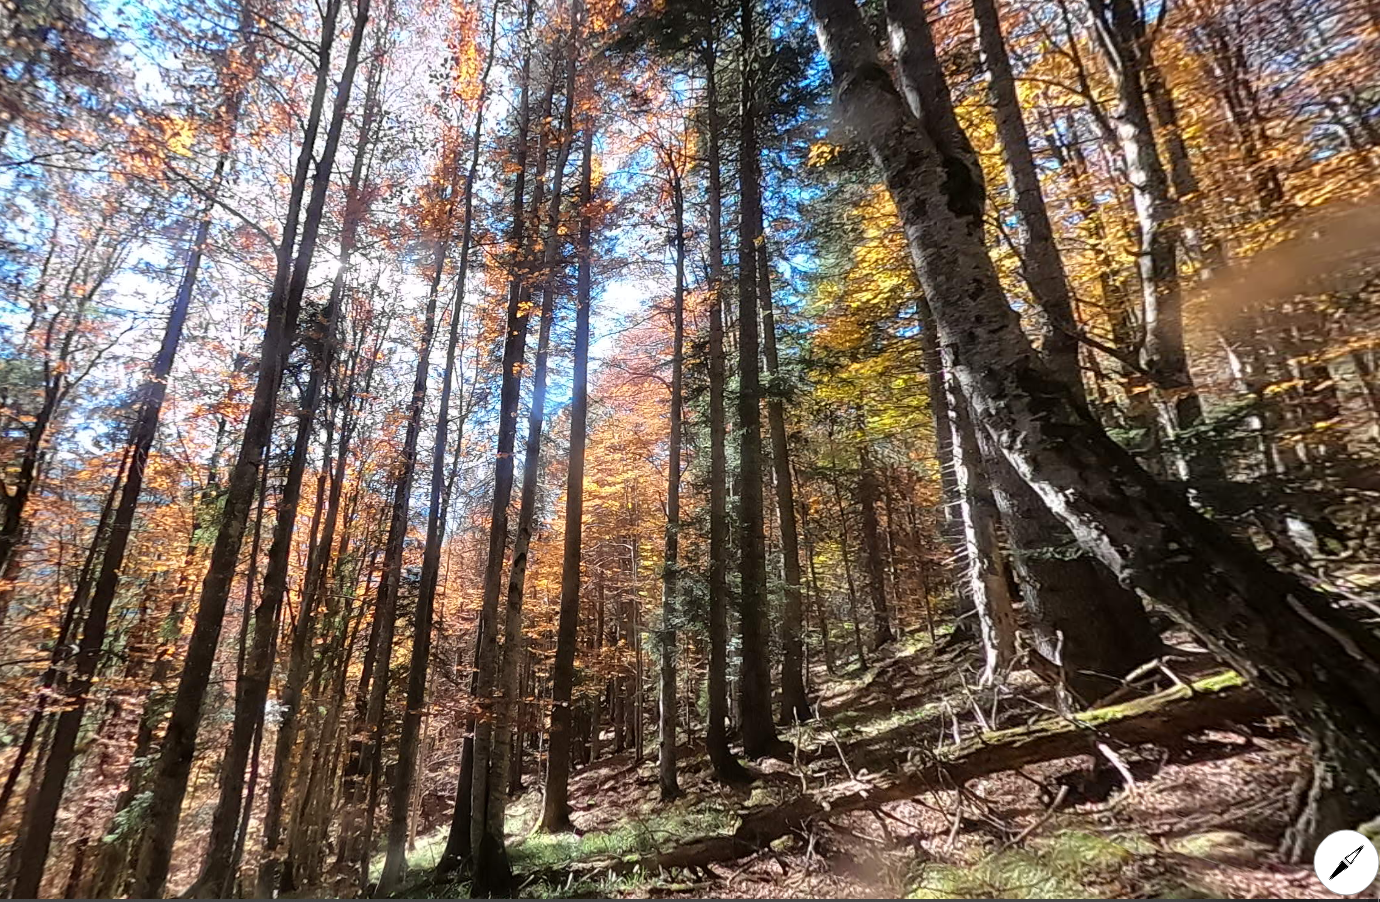
Figure 10 - 360 photospheres used for cross-validating data
1.4. Radial growth sampling
The IML RESI PowerDrill resistograph was used to establish the radial growth of the trees.
PowerDrill IML-RESI digitally presents the quality of the wood, measuring the resistance of the drilling needle through the wood core. With a digital wood inspection exercise, measurements are easy to perform, display and analyze.
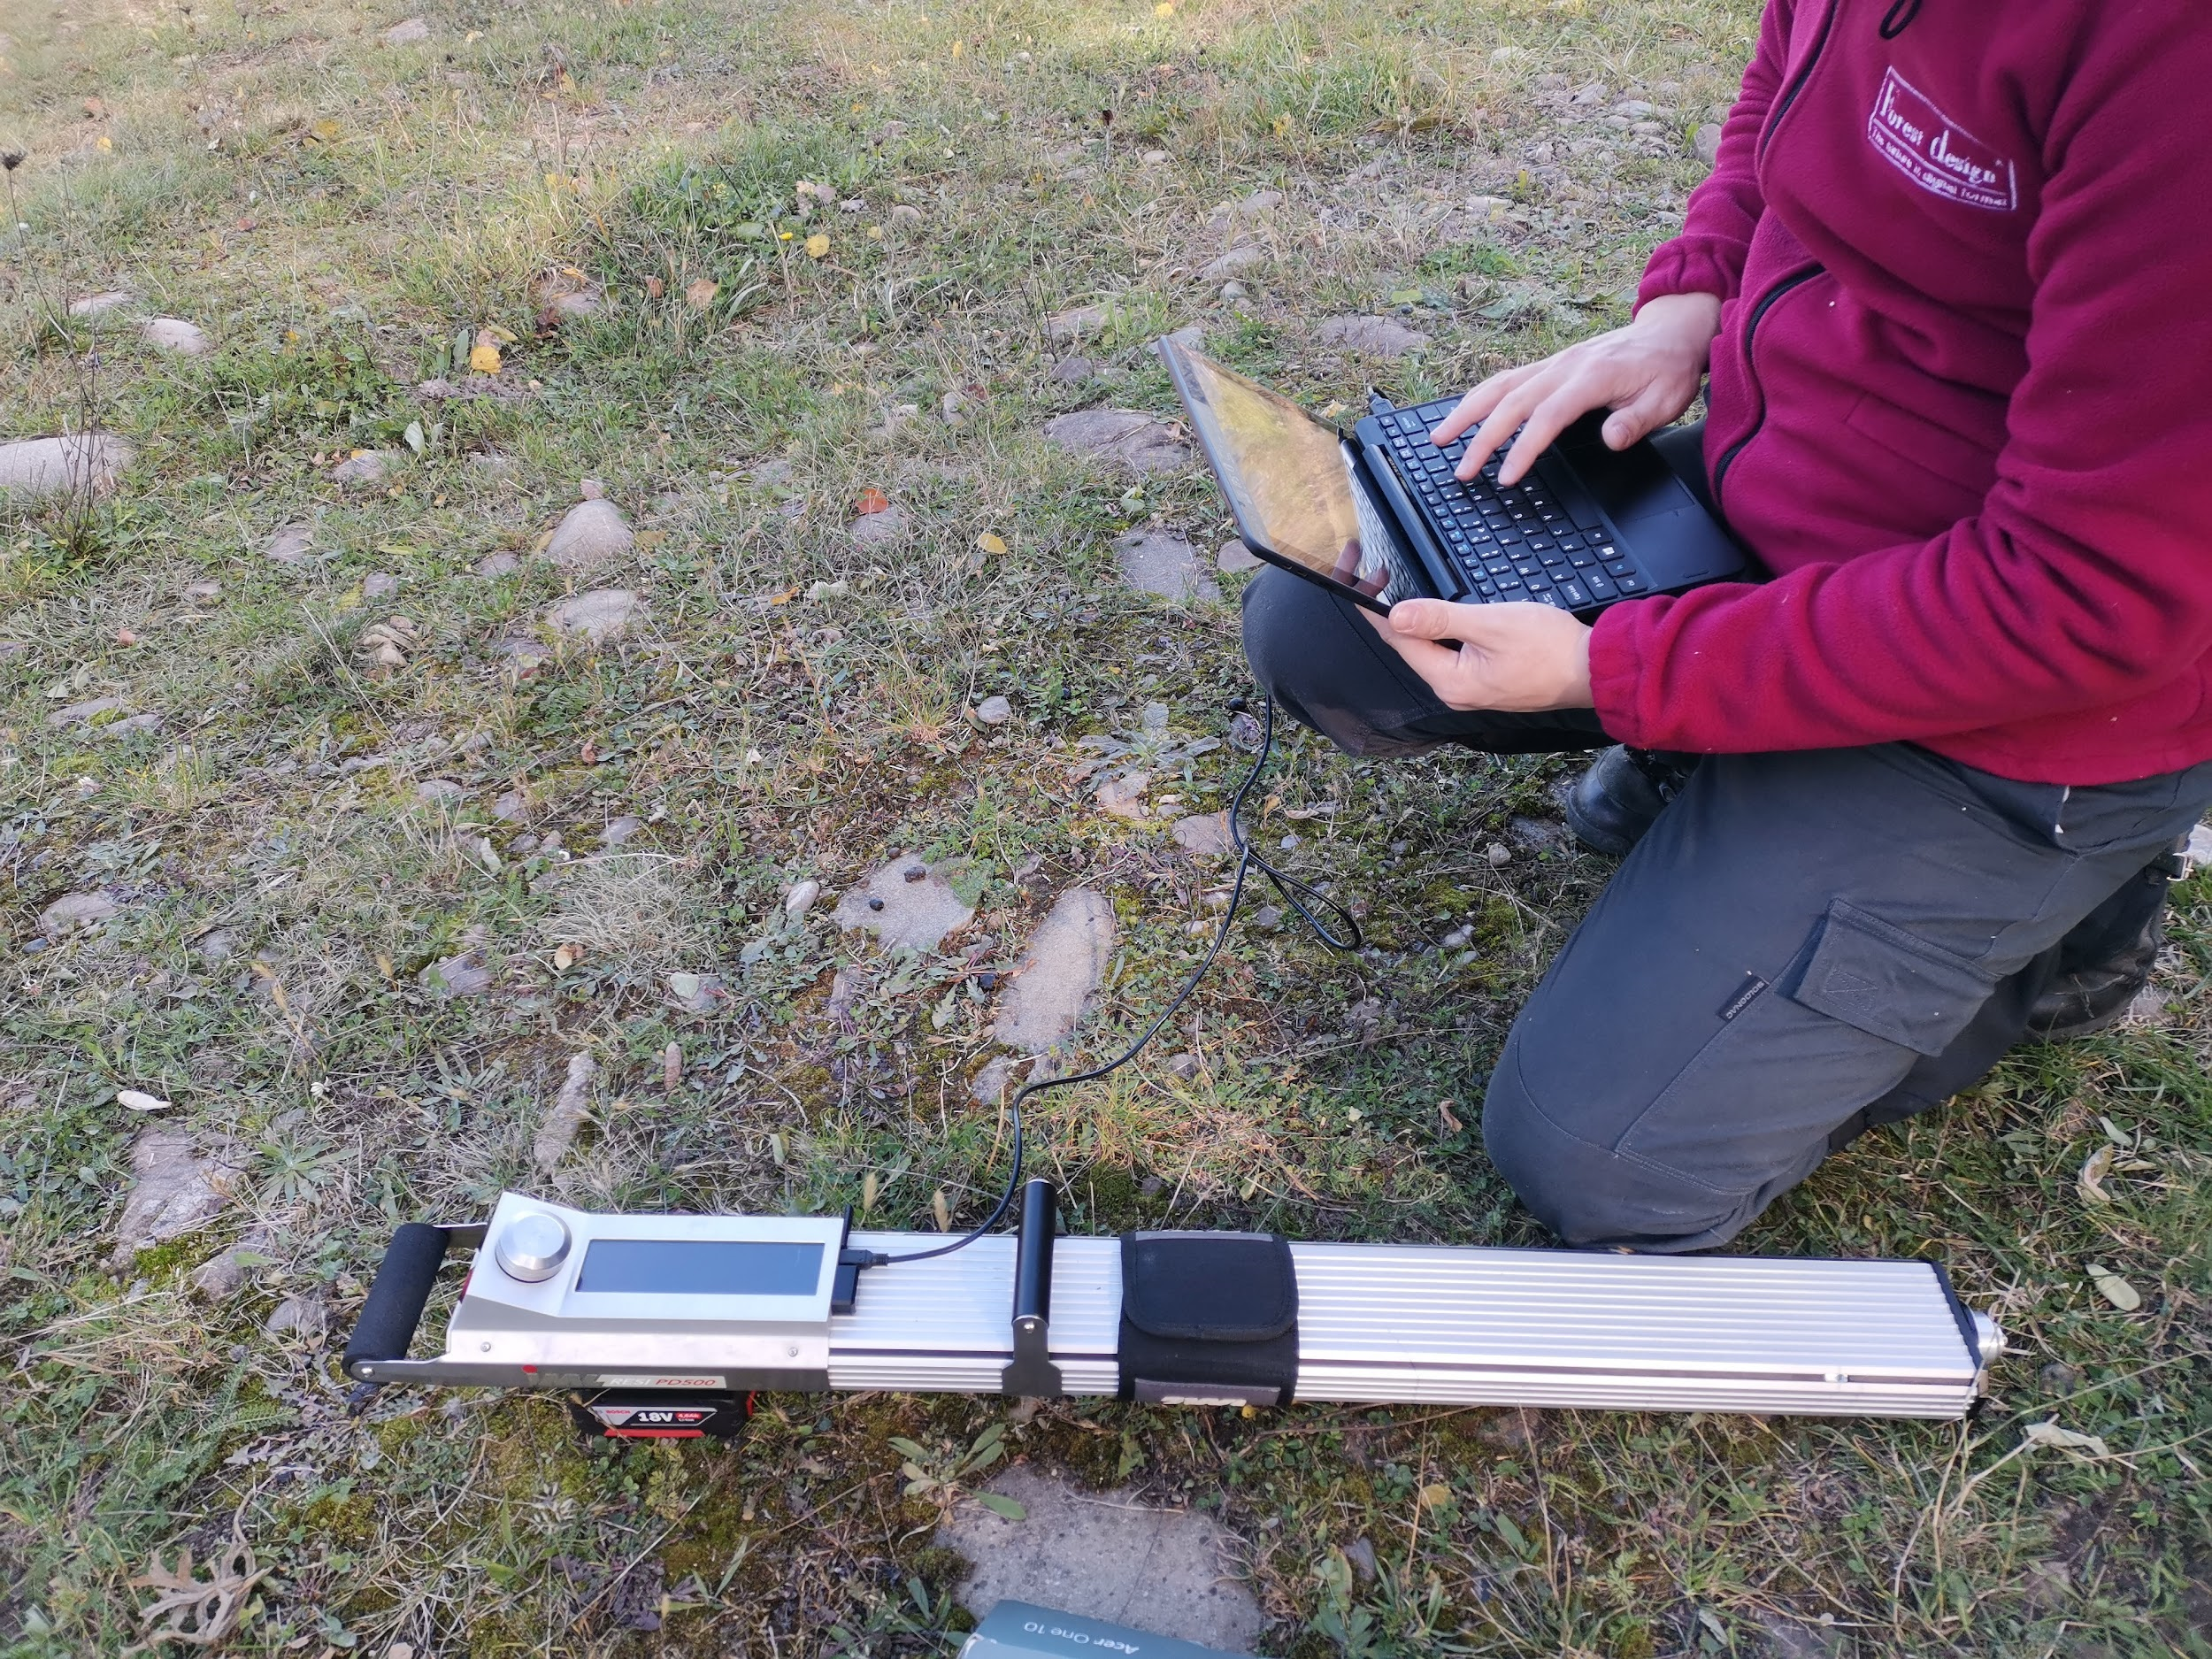
Figure 11 - PowerDrill IML-RESI
Peaks of variation on the chart indicate high strengths and densities, whereas low points on the chart are associated with low strength and density that may be caused by certain defects within the wood, such as burrs, rot, wood in different stages of degradation, or cracks.
Figure 12 - Resistograph reading overlapped on the scanned image
Finally, the process of "reading" each growth sample follows and results with values regarding:
- The age of the tree
- Diameter at 1.3 (sampling height)
- The thickness of the annual rings
- Bark thickness
- The average growth over the desired period
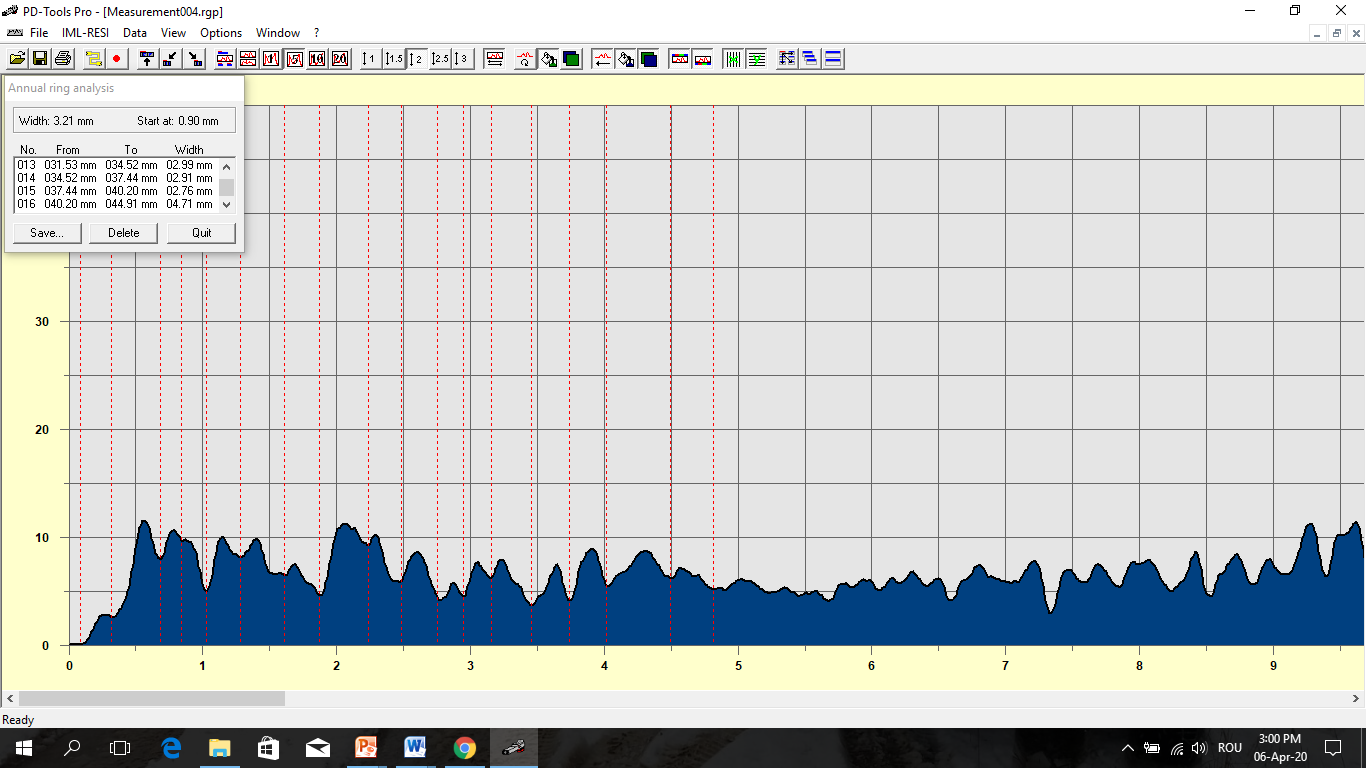
Figure 13 - Process of reading the growth
2. Results
2.1. Forest and tree characteristics at plot level
For each plot, the forest stand and tree characteristics were calculated and presented in the below format of presentation. Each plot sheet has its own individual sheet.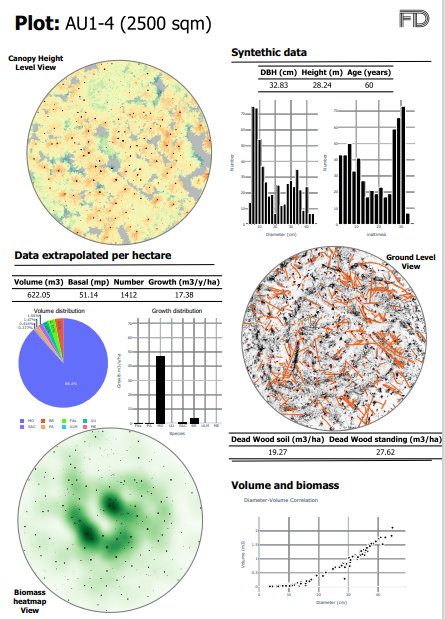
Figure 14 – Example of plot sheet showing the aggregated information extrapolated to 1 hectare
The plot sheet contains:
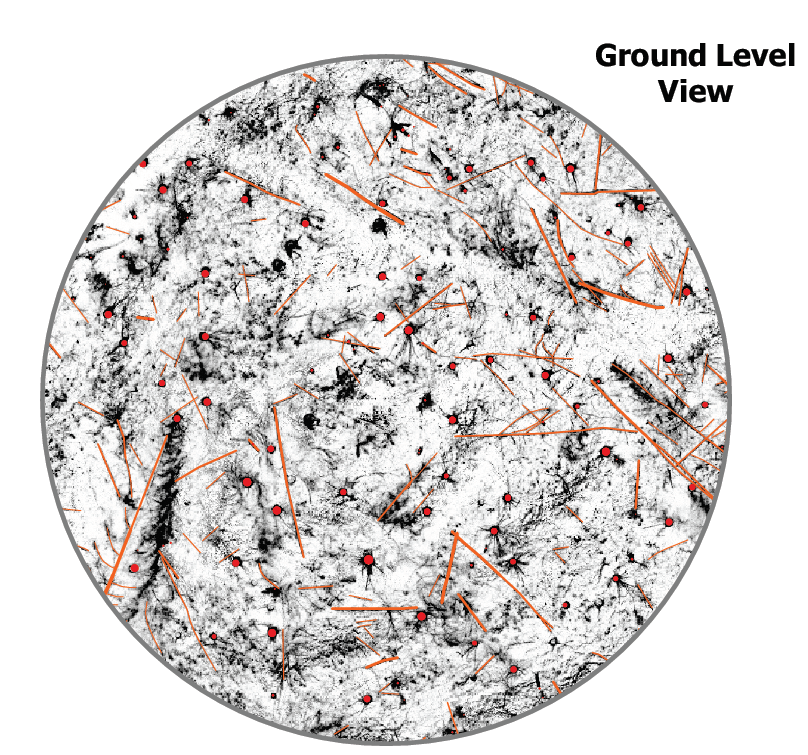
- the canopy height level view showing the projection of the trees and the location of each tree drawn as a circle with a diameter equal to DBH
- synthetic data about the average DBH, Height, and Age and 2 histograms showing the distribution of the trees in the plot on 2 criteria: diameter and height
- data extrapolated per hectare: volume, basal, number, and growth extrapolated at 1 hectare based on the data in the plot. This section comes with 2 graphs showing the volume and growth distribution per species
- the ground level view shows the data extracted from scanning to better identification of ground-floor elements such as dead trees, stumps, etc.
- volume and biomass showing the diameter-volume correlation, carbon stock measured on 3D unique shapes of the trees, and a biomass heatmap view
Both standing and on-ground deadwood were measured with the same method as the live trees, taking into account the tree characteristics that could influence biomass (with/without branches, twigs, etc.). For both the on-ground and standing dead trees were used the same methods of estimations were based on the VirtSilv algorithm.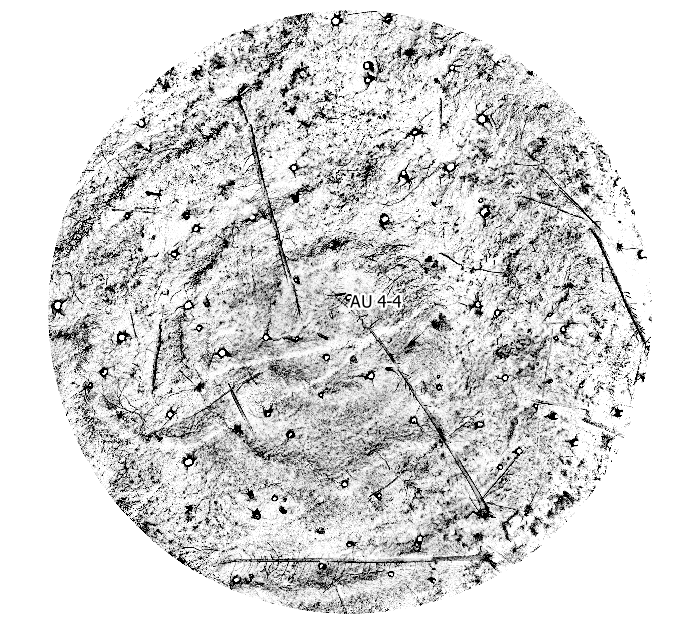
Figure 15 – Dead tree identified both in the 2D photo and in the field
2.3. Linking satellites and TLS for forestry
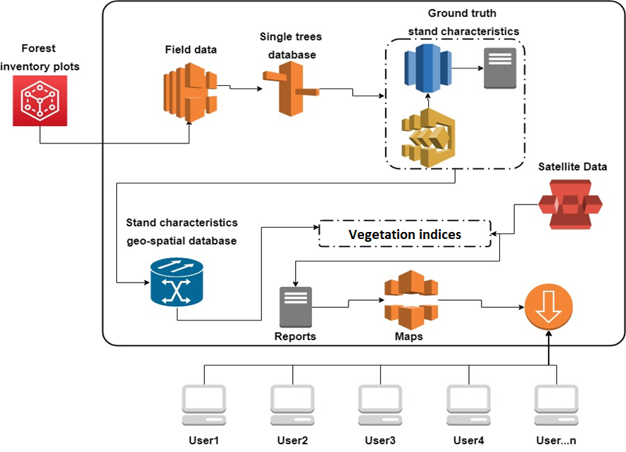
Figure 16 - Linking schematics
Modeling forest age, basal area, diameter, height, number, and volume at pixel level demonstrated on large areas. The algorithms can be implemented on other infrastructures.
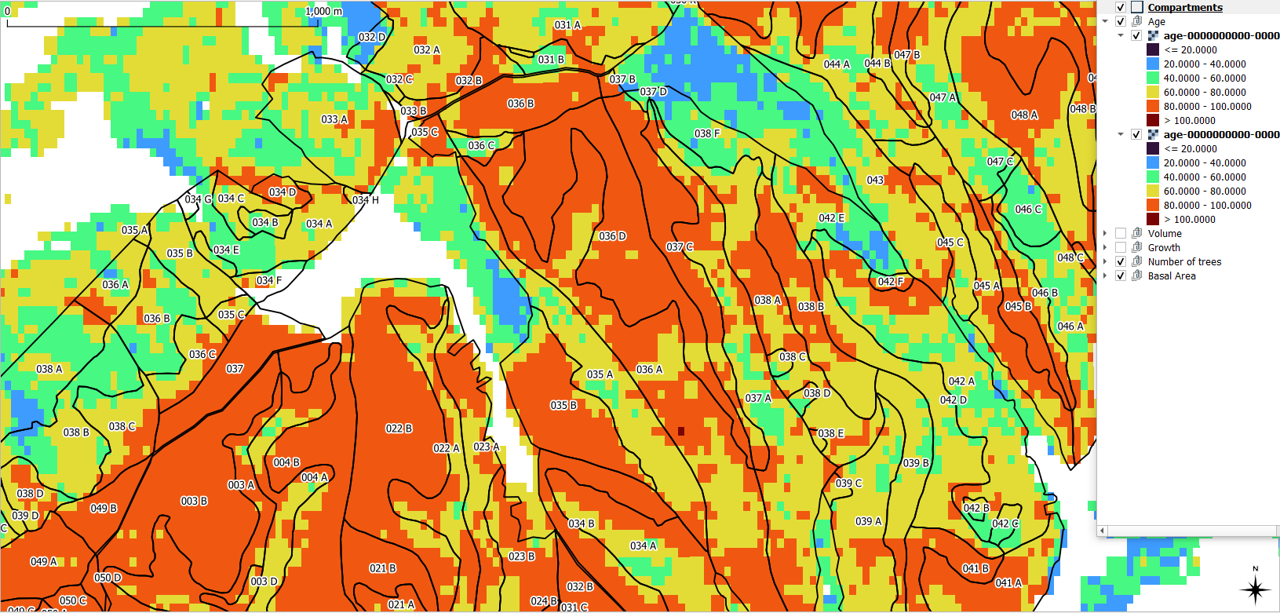
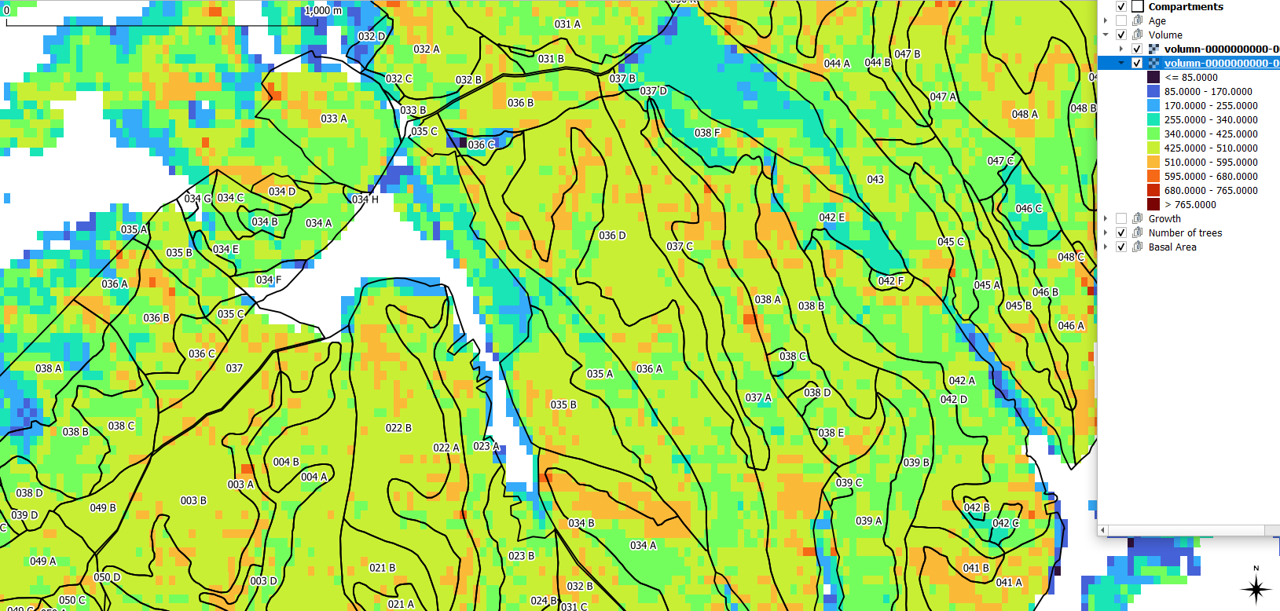
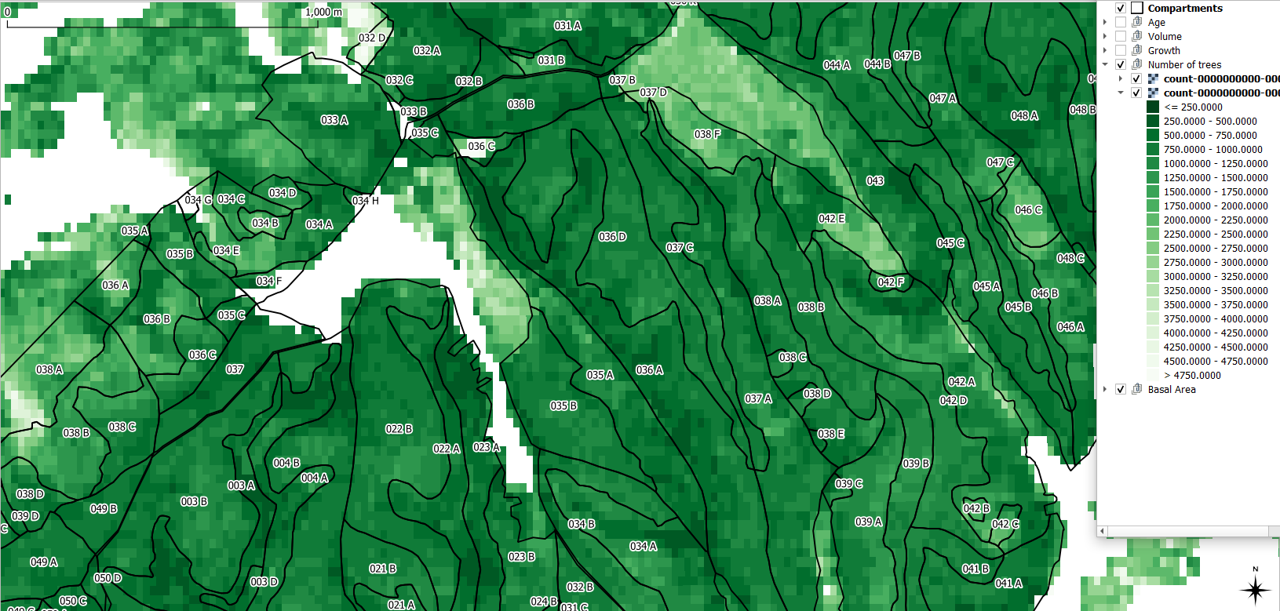
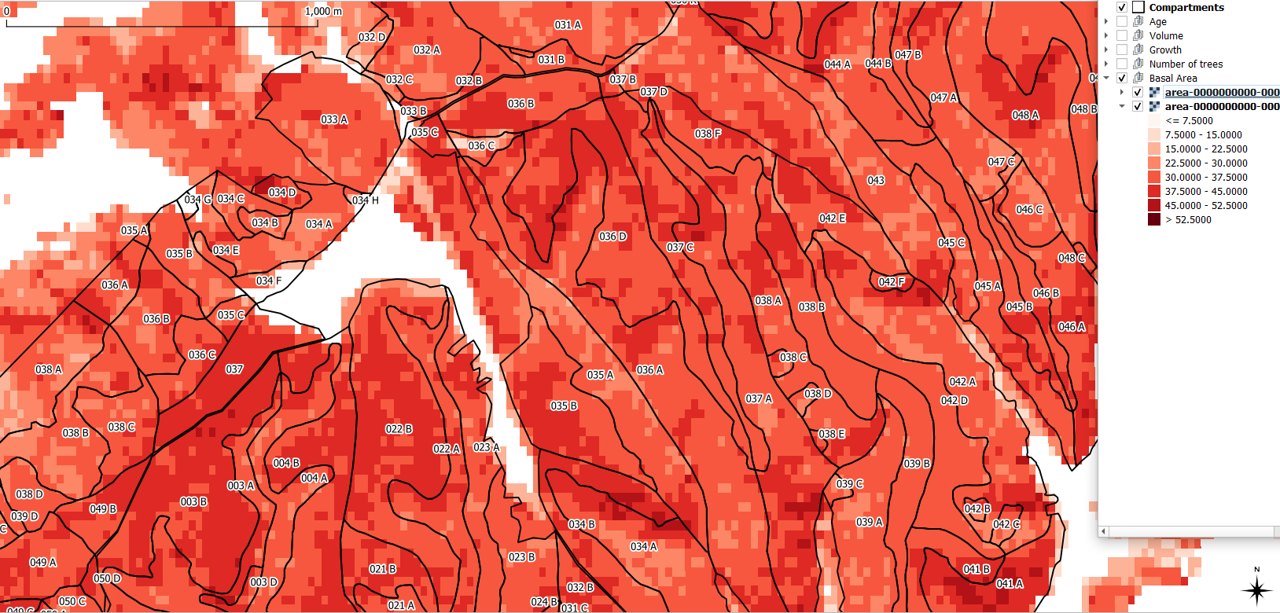
Figure 17 - Biometrics of tree at different levels
VirtSilv is scalable, highly customizable, and can adapt to specifics. Check out more by clicking the button below!
![]()