VIRTSILV Concept - Conifer case study
Automatic tree extraction from LIDAR data. Virtual measurements, digital model and analytics of VirtSilv platform in a coniferous forest.
NOTE: This is an older article about VirtSilv capabilities, now, thanks to the artificial intelligence the product capabilities are greatly enhanced, The purpose of this article is to show the basic concept of VirtSilv functions.
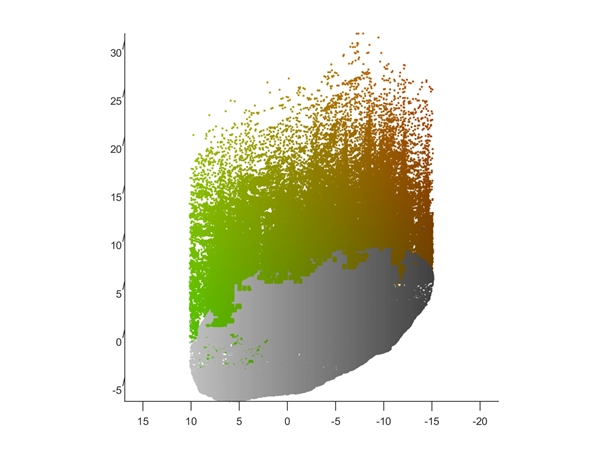
Fig.1. Scanned area of interest
What we see are fake colors, generated by the application after the automatic separation of ground and trees (the gray zone is the ground). This image corresponds to a view along the X-axis of the local Spatial Reference System (SRS). The individual trees are not yet extracted, but they can be seen by the human eye.

Fig.2. Same representation as in Fig.1., this time the view is along the main diagonal of the SRS; let's call this view the XYZ view.
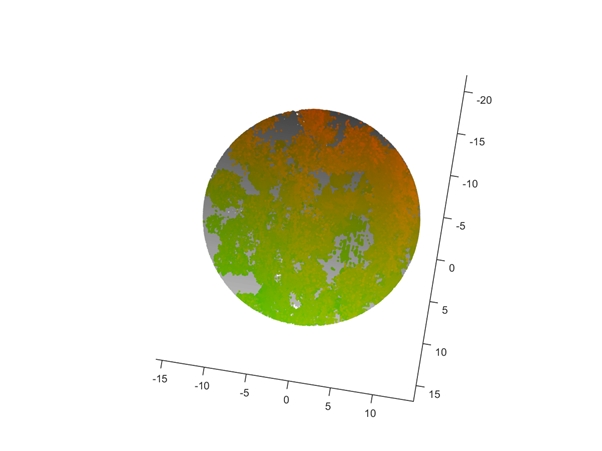
Fig.3. View from above (along the Z axis).

Fig.4. Raw extraction of the (potential) trees. Each tree receives a unique color code. You are looking at the X-view. There are 71 potential trees.

Table 1. Data analytics with respect to each extracted tree. The ID is related with the number code of the initial potential trees (some of the initially considered candidates can split into several individual trees, like in the case of the initial tree no.3 (25, 26, 29, 34, 51, 66, 70), while others may not produce an extraction after all). The (Xo,Yo,Zo) coordinates are for the center of the trunk, at ground level. DBH130cm is the virtual measurement of the trunk diameter at 130 cm above the ground. Height observed is the virtual measurement of the trunk height, up to where the coherent observational data ends. Height estimated is based on an empirical formula which gives an estimation based on the value of DBH130cm. Volume observed is the virtual measurement of the trunk volume, based strictly on observational data. Volume estimated is a theoretical approximation of the total volume of the trunk, based on the volume observed and on the above mentioned height estimation.
Tree no.1

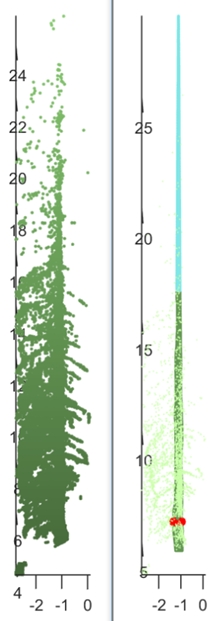
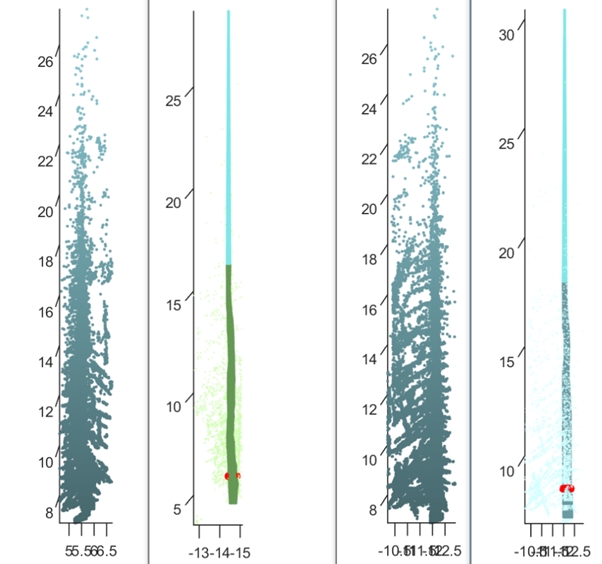
Fig.E1a. Left: the observed data. Right: the digital model of the trunk, composed of two parts: 1. the lower segment, with a complex geometric shape, following the observed data and 2. the upper segment, a conic approximation of the top of the trunk (the portion which is missing from the LIDAR data or is obscure). Here we have the view along the X axis. The red zone marks the 130 cm height.
Fig.E1b. Here we have the view along the Y axis


The data has been taken up with mobile mapping technology - GeoSLAM ZEB-REVO.
If someone is interested in receiving processing results using our algorithm on their scanned area with any kind of device scanner, please write us an email with the form completed and send us the data you want to process.
e-mail: This email address is being protected from spambots. You need JavaScript enabled to view it.
Form: https://docs.google.com/document/d/1ABzhbChQoJbuvMJeEzBxOQbZ4iymU-8s6tM19rZmCvg/edit?usp=sharing
THANK YOU FOR READING!